Using Google Street View, this project from MIT shows where cities need to do more planting.
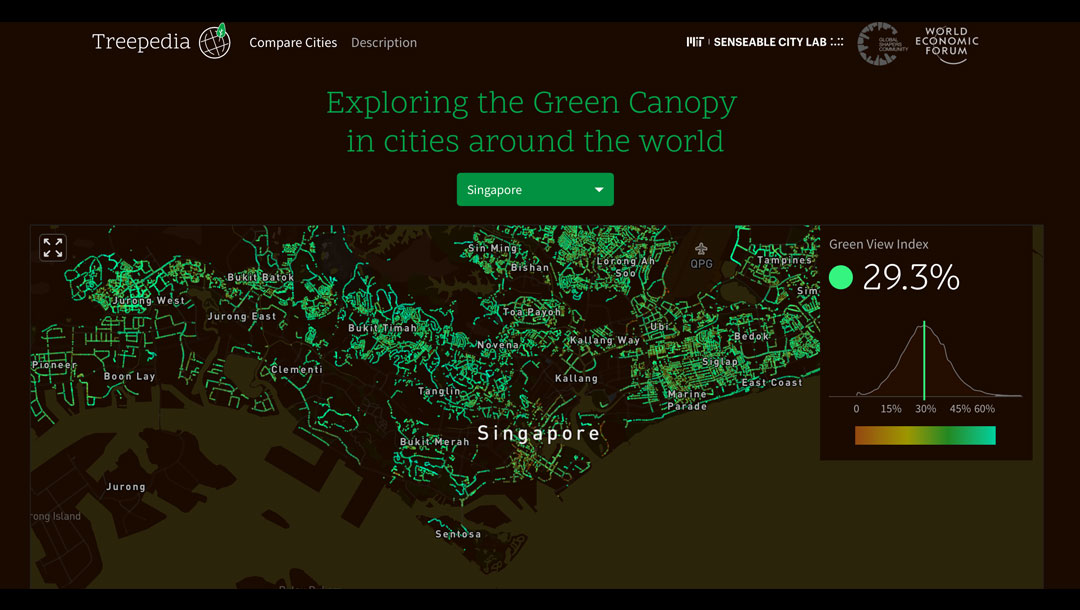
A new project called Treepedia uses an algorithm and Google Street View to map trees in cities, making it possible to see the stark differences in greenery between streets and cities as a whole.
In the first stage of the project, the researchers mapped greenery in 12 cities. Green dots on each map indicate higher tree coverage, brown dots mean fewer trees, and black areas haven’t been analyzed yet; the median number gives the city its score.
“Using satellite imagery would have given us a percentage of canopy cover from a bird’s-eye view, which doesn’t necessarily correlate to what people see in the city. ” This is an important (and often overlooked) perspective as there are many health benefits to urban trees, such as reducing our stress levels,” say by Newsha Ghaeli, the project lead, and Carlo Ratti, director of Sensable City Lab. ” Therefore, By using Google Street View to measure canopy cover, rather than satellite images, researchers from MIT’s Sensable City Lab were able to get a better sense of how people on a street perceive the number of trees.
Newer cities—like Vancouver, with a high score of 25.9%—do better than older cities like Paris, with a score of only 8.8%.
“The goal of this project is to start a conversation so that cities can see how they compare with one another and how they can learn from each other,” the researchers say. In the next phase of the project, the algorithm will be tweaked to begin identifying tree species, and residents on a block will also be able to tag trees—and make requests for the city to plant more.
“In the long term, this could become almost like a social network connecting people and trees,” say Ratti and Ghaeli.
source : fastcoexist


